4QFY2019 Result Update | Auto Ancillary
May 28, 2019
Automotive Axles
HOLD
CMP
`1192
Target Price
`1400
Investment Period
12 Months
Performance Update
Quarterly (` cr)
Q4FY19
Q4FY18
% yoy Q3FY19
% qoq
Stock Info
Net sales
481
469
3%
486
-1%
Sector
Auto Ancillary
EBITDA
58
55
7%
56
4%
Market Cap (` cr)
1,830
Net Debt (` cr)
20
EBITDA margin (%)
12.1%
11.6%
49
11.5%
11
Beta
0.9
Adjusted PAT
29.84
26.40
13.0%
30.79
-3%
52 Week High / Low
1552/991
Avg. weekly Volume
4,058
Face Value (`)
10
In Q4FY2019, net sales of Automotive Axle Ltd. (AAL) were marginally up by
BSE Sensex
39,683
Nifty
11,924
2% on yoy basis and stood at `481cr on the back of slowdown in commercial
Reuters Code
ATOA.BO
vehicle sales during the quarter. Gross margin improved by
36bps yoy
Bloomberg Code
ATXL IN
resulting in an overall improvement of OPM by 49bps yoy to 12.14%, which
Shareholding Pattern (%)
aided EBDTA to grow at 7% yoy to `58cr as compared to `55cr in Q4FY2018.
Promoters
71.0
MF / Banks / Indian Fls
9.5
Profit for Q4FY2019 jumped by 13% yoy to `30cr owing to the stable interest
FII / NRIs / OCBs
1.3
and depreciation cost. Overall, Automotive Axle has
delivered good
Indian Public / Others
18.2
performance in tough environment where OEM sales and production has been
Abs.(%)
3m
1yr
3yr
flat during the quarter under review.
Sensex
10.5
13.6
44.0
Management has given very cautious guidance of flattish growth in revenue for
Automotive Axles
0.3
(11.5)
58.4
FY2020 due to the ongoing slowdown and upcoming BS-VI transition, which as
per management may impact the overall industry growth.
The management expects to deliver revenue in the range of `1,900-2,000cr in
FY20. However, management believes that growth should pick-up from
Q1/Q2FY2021.
PBT margin is expected to be in the range of 8.7-9.2% on account of higher
depreciation and interest costs.
Key things to watch for: (1) Growth in revenue from slip suspension;
(2)
Capacity utilization & expansion plan; and (3) Increasing pie from exports
segment.
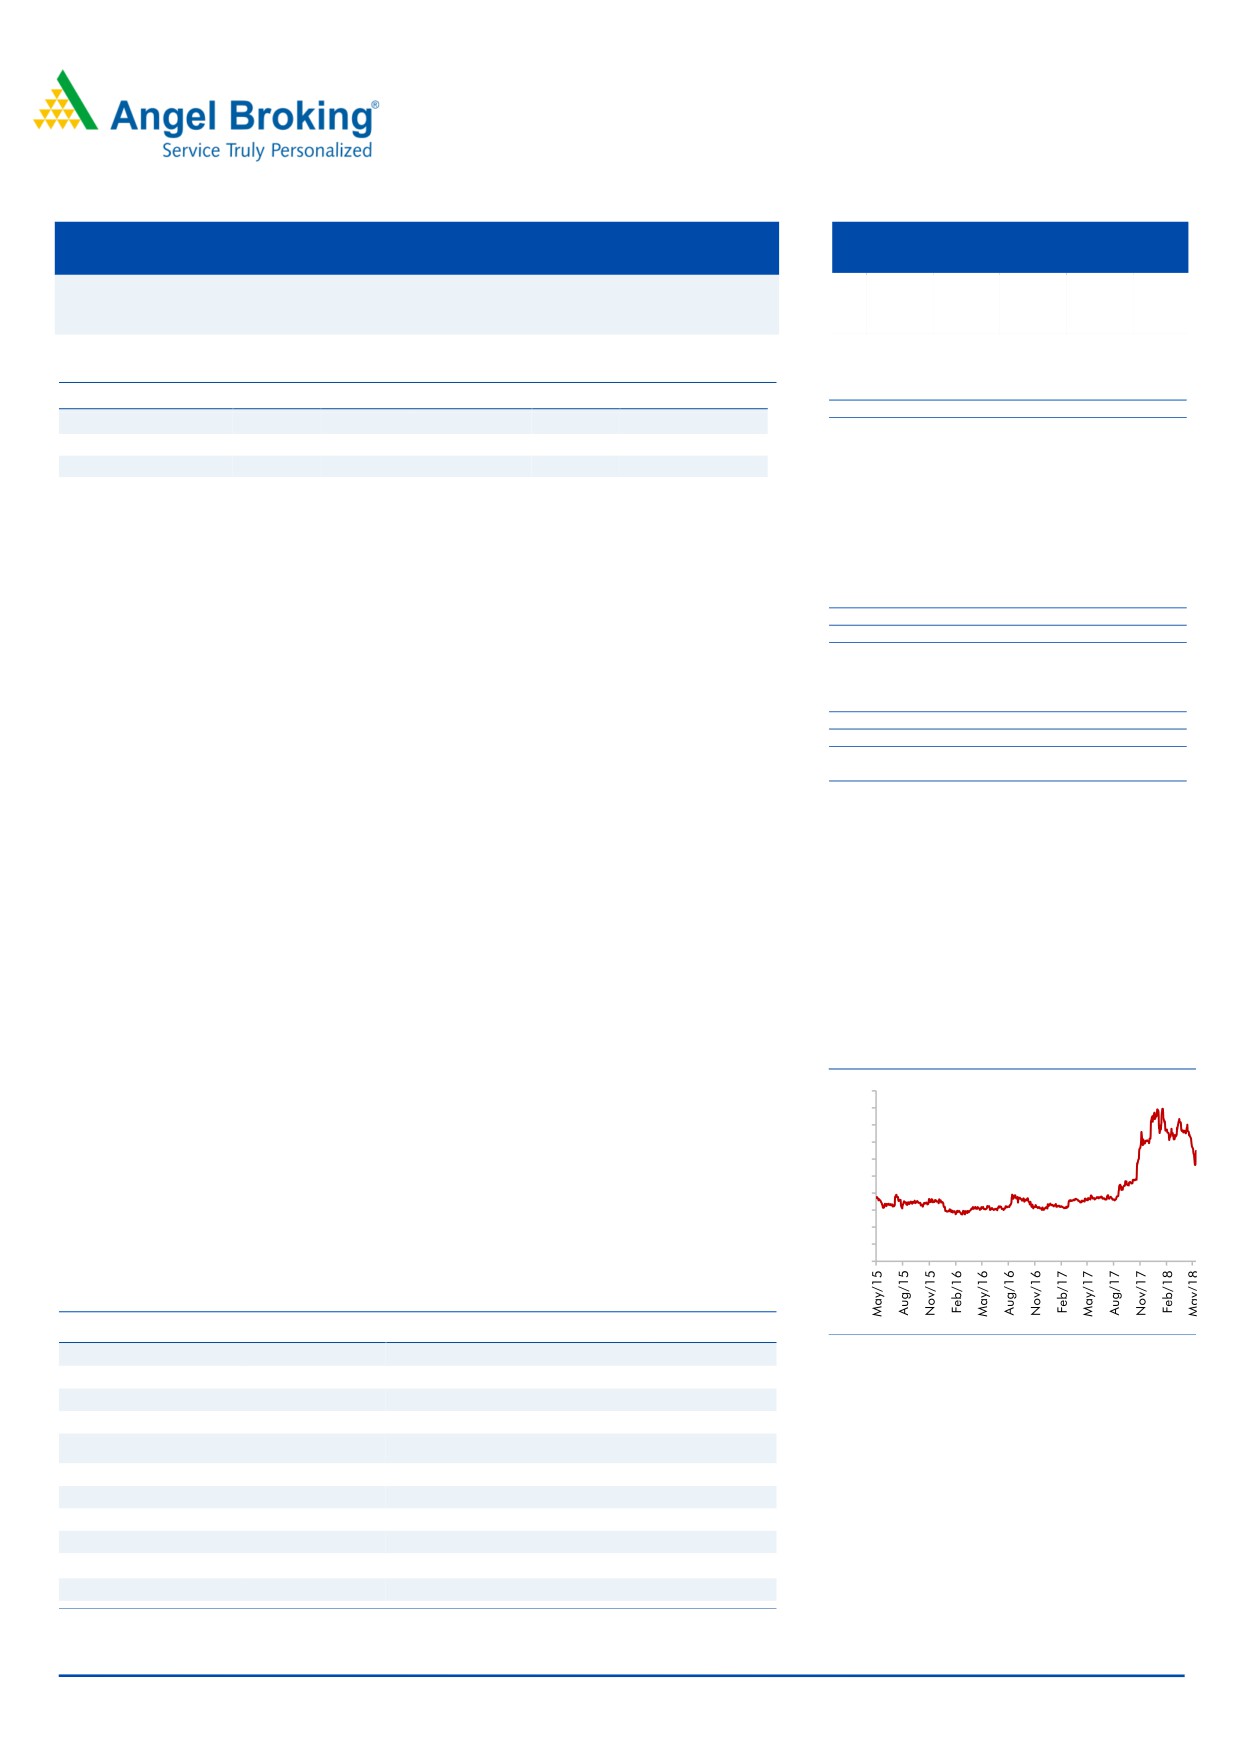
3years performance chart
Outlook & Valuation: We believe that AAL is comfortably placed to tap the
2000
upcoming opportunity in the industry owing to improving road infra, BS-VI pre-
1800
buying and foray into new segment coupled with expansion of capacity by 35-
1600
1400
40%. However, medium term scenario looks tough, but long term prospects
1200
seem positive. At the CMP of `1,192, the stock is available at 15X its FY2021E
1000
800
EPS of `78. We assign a multiple of 17.5X and recommend HOLD on AAL with
600
a Target Price of
`1,400, implying an upside of 18% over the next 9-12
400
200
months.
0
Key Financials
Y/E March (` cr)
FY18
FY19
FY20E
FY21E
Net Sales
1,519
1,939
1,980
2,131
Source: Company, Angel Research
% chg
30
28
2
8
Net Profit
84
122
109
118
% chg
70
45
(10)
9
EBITDA (%)
11.0%
11.8%
12.0%
11.9%
EPS (Rs)
56
80
72
78
P/E (x)
21
15
16.3
15.0
P/BV (x)
4.0
3.3
2.8
2.4
Kripashankar Maurya
RoE (%)
18.9
22.6
17.3
16.3
022-39357800 Ext: 6004
RoCE (%)
27.9
30.3
23.5
23.2
EV/EBITDA
10.4
7.9
7.6
6.7
Source: Company, Angel Research
Valuation done based on 27th May, 2019 closing price
Please refer to important disclosures at the end of this report
1
Automotive Axles | 4QFY2019 Result Update
Company Background
Established in 1981, Automotive Axles Limited (AAL) is a joint venture of Kalyani Group
and Meritor Inc., USA. With manufacturing facilities located at Mysore (Karnataka) and
Jamshedpur (Jharkhand), the company manufactures drive axles, non-drive axles, front
steer axles, specialty & defence axles and drum & disc brakes. It provides these
products to major domestic and global manufacturers of trucks & buses pertaining to
segments such as light, medium & heavy commercial vehicles, military & off-highway
vehicles, aftermarket and exports. As a continuous process, the company believes in
introducing new products regularly in order to meet the emerging needs of the
commercial vehicle market.
About JV with Meritor
The products manufactured by AAL are based on technology provided by the parent
Meritor Inc., USA. The technology transfer by Meritor Inc. is routed through its 51%
subsidiary in India - Meritor HVS (India) Limited (MHVSIL). MHVSIL is also responsible
for customer sourcing, interaction and marketing for AAL, with almost the entire sales of
AAL routed through MHVSIL. MHVSIL is 51:49 JV between Meritor International, USA
and Bharat Forge with Meritor holding majority stake. AAL manufactures and sells
axles, components, brake components and subassemblies to MHVSIL, which in turn
sells it to the end customer.
Outlook & Valuation: We believe that AAL is comfortably placed to tap the upcoming
opportunity in the industry owing to improving road infra, BS-VI pre-buying and foray
into new segment coupled with expansion of capacity by 35-40%. However, medium
term scenario looks tough, but long term prospects seem positive. At the CMP of
`1,192, the stock is available at 15X its FY2021E EPS of `78. We assign a multiple of
17.5x and recommend HOLD on AAL with a Target Price of `1,400, implying an
upside of 18% over the next 9-12 months.
May 28, 2019
2
Automotive Axles | 4QFY2019 Result Update
Quarterly performance
In Cr
Q4FY19
Q4FY18
Q3FY19
YOY %
QOQ%
Net Sales
481
469
486
2.5%
-1.0%
Total Income
481
469
486
2.5%
-1.0%
Total Expenditure
423
414
430
2.0%
-1.7%
Raw Material Consumed
292
330
396
-12%
-26%
Stock Adjustment
48
0
-60
NA
-180%
Purchase of Finished Goods
0
0
0
NA
NA
COGS
340
330
335
3.1%
1.4%
Employee Expenses
29
27
31
9.2%
-6.5%
% of sales
6.1%
5.7%
6.4%
7%
-6%
Other Expenses
53
58
63
-8%
-16%
As a % of sales
11.1%
12.3%
13.0%
Raw Material Consumed
60.7%
70.3%
81.4%
Stock Adjustment
10.0%
0.0%
-12.4%
Purchase of Finished Goods
0.0%
0.0%
0.0%
COGS
70.7%
70.3%
69.0%
Gross Margin %
29.3%
29.7%
31.0%
-36
Other Expenses
11.1%
12.3%
13.0%
EBITDA
58
55
56
7%
4%
Other Income
0.47
0.9
0.7
-47%
-34%
Interest
0.01
0.2
0.2
-93%
-92%
PBDT
58.83
55.34
56.60
NA
4%
Depreciation
9.97
12
11
-16%
-13%
PBT
48.86
43.45
45.15
12%
8%
Tax
19.03
17
14
12%
33%
PAT
30
26
31
13%
-3%
Ratios
BPS
BPS
EBITDA margin (%)
12.14%
11.65%
11.54%
49
60
PAT margin %
6.20%
5.63%
6.34%
57
-14
Tax rate %
38.94%
39.24%
31.79%
-30
715
Source: Company, Angel Research
May 28, 2019
3
Automotive Axles | 4QFY2019 Result Update
Income Statement
Y/E March (` cr)
FY18
FY19
FY20E
FY21E
Total operating income
1,519
1,939
1,980
2,131
% chg
30
28
2
8
Total Expenditure
1,352
1,710
1,742
1,877
Raw Material
1,079
1,380
1,396
1,494
Personnel
99
124
119
128
Selling and Administration Expenses
23
-
20
21
Others Expenses
151
207
208
234
EBITDA
167
229
238
254
% chg
47
37
4
7
(% of Net Sales)
11.0%
11.8%
12.0%
11.9%
Depreciation& Amortization
43
46
64
72
EBIT
124
183
173
182
% chg
67
48
(5)
5
(% of Net Sales)
8
9
9
9
Interest & other Charges
1
1
11
6
Other Income
5
3
3
4
Recurring PBT
128
185
166
180
% chg
70
45
(11)
9
Tax
44
64
57
62
PAT (reported)
84
122
109
118
% chg
70
45
(10)
9
(% of Net Sales)
5.5
6.3
5.5
5.5
Basic & Fully Diluted EPS (Rs)
56
80
72
78
% chg
70
45
(10)
9
Source: Company, Angel Research
May 28, 2019
4
Automotive Axles | 4QFY2019 Result Update
Balance sheet
Y/E March (`cr)
FY18
FY19
FY20E
FY21E
SOURCES OF FUNDS
Equity Share Capital
15.1
15.1
15.1
15.1
Reserves& Surplus
429
523
614
712
Shareholders Funds
444
538
629
727
Total Loans
-
66
110
60
Other Liabilities
2
0
0
0
Total Liabilities
446
604
739
787
APPLICATION OF FUNDS
Net Block
118
109
172
164
Capital Work-in-Progress
17
116
116
116
Investments
6
15
15
16
Long Term Loans & Advances
21
45
46
46
Current Assets
570
642
753
848
Inventories
137
184
163
175
Sundry Debtors
350
346
434
467
Cash
44
40
90
139
Loans & Advances
1
6
6
6
Investments & Others
37
65
61
60
Current liabilities
285
321
362
403
Net Current Assets
285
321
391
445
Other Non Current Asset
-
-
-
-
Total Assets
446
604
739
787
Source: Company, Angel Research
Cash Flow
Y/E March (`cr)
FY18
FY19
FY20E
FY21E
Profit before tax
128
185
166
180
Depreciation
43
46
64
72
Change in Working Capital
81
(22)
(49)
22
Interest / Dividend (Net)
1
1
11
6
Direct taxes paid
44
64
57
62
Others
(245)
(92)
(9)
(107)
Cash Flow from Operations
51
182
240
235
(Inc.)/ Dec. in Fixed Assets
(30)
9
101
101
(Inc.)/ Dec. in Investments
3
(9)
(0)
(1)
Cash Flow from Investing
(27)
0
100
100
Issue of Equity
-
-
-
-
Inc./(Dec.) in loans
-
66
44
-50
Others
(15)
(253)
(335)
(235)
Cash Flow from Financing
(15)
(187)
(290)
(285)
Inc./(Dec.) in Cash
9
(4)
50
49
Opening Cash balances
35
44
40
90
Closing Cash balances
44
40
90
139
Source: Company, Angel Research
May 28, 2019
5
Automotive Axles | 4QFY2019 Result Update
Key Ratio
Y/E March
FY18
FY19
FY20E
FY21E
P/E (on FDEPS)
21
15
16
15
P/CEPS
10
8
8
7
P/BV
4
3
3
2
EV/Sales
1
1
1
1
EV/EBITDA
10
8
8
7
EV / Total Assets
2
2
2
1
Per Share Data (Rs)
EPS (Basic)
56
80
72
78
EPS (fully diluted)
56
80
72
78
Cash EPS
113
152
151
166
DPS
14
20
14
14
Book Value
294
356
416
481
Returns (%)
ROCE
28
30
23
23
Angel ROIC (Pre-tax)
33
42
33
35
ROE
19
23
17
16
Turnover ratios (x)
Inventory / Sales (days)
33
35
30
30
Receivables (days)
84
65
80
80
Payables (days)
62
49
60
60
Working capital cycle (ex-cash) (days)
55
51
50
50
Source: Company, Angel Research
May 28, 2019
6
Automotive Axles | 4QFY2019 Result Update
Research Team Tel: 022 - 39357800
DISCLAIMER:
Angel Broking Limited (hereinafter referred to as “Angel”) is a registered Member of National Stock Exchange of India Limited, Bombay
Stock Exchange Limited, Metropolitan Stock Exchange Limited, Multi Commodity Exchange of India Ltd and National Commodity &
Derivatives Exchange Ltd It is also registered as a Depository Participant with CDSL and Portfolio Manager and Investment Adviser with
SEBI. It also has registration with AMFI as a Mutual Fund Distributor. Angel Broking Limited is a registered entity with SEBI for Research
Analyst in terms of SEBI (Research Analyst) Regulations, 2014 vide registration number INH000000164. Angel or its associates has not
been debarred/ suspended by SEBI or any other regulatory authority for accessing /dealing in securities Market. Angel or its
associates/analyst has not received any compensation / managed or co-managed public offering of securities of the company covered
by Analyst during the past twelve months.
This document is solely for the personal information of the recipient, and must not be singularly used as the basis of any investment
decision. Nothing in this document should be construed as investment or financial advice. Each recipient of this document should make
such investigations as they deem necessary to arrive at an independent evaluation of an investment in the securities of the companies
referred to in this document (including the merits and risks involved), and should consult their own advisors to determine the merits and
risks of such an investment.
Reports based on technical and derivative analysis center on studying charts of a stock's price movement, outstanding positions and
trading volume, as opposed to focusing on a company's fundamentals and, as such, may not match with a report on a company's
fundamentals. Investors are advised to refer the Fundamental and Technical Research Reports available on our website to evaluate the
contrary view, if any
The information in this document has been printed on the basis of publicly available information, internal data and other reliable
sources believed to be true, but we do not represent that it is accurate or complete and it should not be relied on as such, as this
document is for general guidance only. Angel Broking Limited or any of its affiliates/ group companies shall not be in any way
responsible for any loss or damage that may arise to any person from any inadvertent error in the information contained in this report.
Angel Broking Limited has not independently verified all the information contained within this document. Accordingly, we cannot testify,
nor make any representation or warranty, express or implied, to the accuracy, contents or data contained within this document. While
Angel Broking Limited endeavors to update on a reasonable basis the information discussed in this material, there may be regulatory,
compliance, or other reasons that prevent us from doing so.
This document is being supplied to you solely for your information, and its contents, information or data may not be reproduced,
redistributed or passed on, directly or indirectly.
Neither Angel Broking Limited, nor its directors, employees or affiliates shall be liable for any loss or damage that may arise from or in
connection with the use of this information.
Disclosure of Interest Statement
Automotive Axles
1. Financial interest of research analyst or Angel or his Associate or his relative
No
2. Ownership of 1% or more of the stock by research analyst or Angel or associates or
No
relatives
3. Served as an officer, director or employee of the company covered under Research
No
4. Broking relationship with company covered under Research
No
May 28, 2019
7